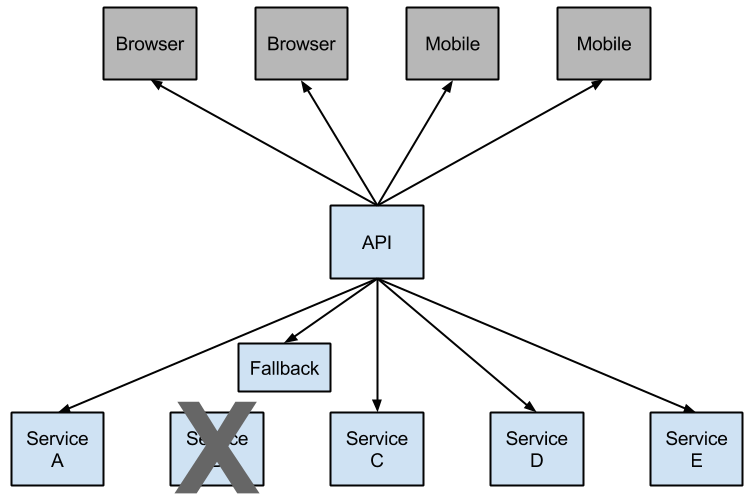
在微服务架构中,通常存在多个服务调用层。微服务之间通过网络进行通信,从而支撑起整个应用,为了保证高可用,单个服务通常也会集群部署。但由于网络原因或者自身原因,每个服务并不能保证100% 可用。而服务间的依赖关系,会导致故障传播,即服务提供者的不可用会导致消费者不可用,并把不可用逐渐放大,这就是雪崩效应。
这里就引入了请求超时机制和断路器模式
Hystrix 简介
Hystrix 是 Netflix 的开源组件,是一个用于实现超时机制和断路器模式的工具类库。在微服务架构中,通常存在多个服务调用层。较低级别的服务中的服务故障可能导致级联故障,一直到达用户。当对特定服务的调用超过一个阈值(默认是 10秒/20个请求/故障百分比 > 50%),断路器将打开并且不会进行调用。在出现错误和开路的情况下,开发人员可以提供一个回退
断路打开后可以防止级联故障。回退可以是另一个受 Hystrix 保护的调用、静态数据或合理的空值。
Ribbon 中整合 Hystrix
我们在 Spring Cloud 服务消费(Ribbon) 中的例子基础上添加 Hystrix
准备工作
- eureka-server 作为服务注册中心
- product-service 作为服务提供者
- 复制工程 order-service-ribbon 为 order-service-ribbon-hystrix 来整合 Hystrix
代码参考:https://github.com/morgan412/spring-cloud-demo/tree/master/netflix
添加 Hystrix 依赖
1 | <dependency> |
主类上添加注解 @EnableCircuitBreaker ,开启断路器功能
1 |
|
在需要容错的方法上添加注解 @HystrixCommand,并指定回调(回退)方法
1 |
|
@HystrixCommand的配置可以比较灵活,可以使用commandProperties属性列出@HystrixProperty注释,例如
2
3
4
5
6
7
8
9
> commandProperties = {
> (name = "execution.isolation.thread.timeoutInMilliseconds", value = "5000"),
> (name = "metrics.rollingStats.timeInMilliseconds", value = "10000")},
> threadPoolProperties = {
> (name = "coreSize", value = "1"),
> (name = "maxQueueSize", value = "10")
> })
>
1 |
|
验证结果
- 启动项目 eureka-server、product-service、order-service-ribbon-hystrix
- 访问 http://localhost:8081/product/1 ,得到正常结果
- 关闭 product-service 服务,再访问 http://localhost:8081/product/1 ,得到结果
{"id":-1,"name":"默认商品","description":null,"price":null,"count":null}。说明当调用的服务不可用时,执行了回退方法
Feign 使用 Hystrix
Feign 使用声明式的接口,没有方法体,所以通过注解的方式显然不适合 Feign。Spring Cloud 已经默认为 Feign 整合了 Hystrix。我们在 Spring Cloud 服务消费(Feign) 中的例子基础上使用 Hystrix
准备工作
- eureka-server 作为服务注册中心
- product-service 作为服务提供者
- 复制工程 order-service-feign 为 order-service-feign-hystrix 来使用 Hystrix
为 Feign 添加回退
Spring Cloud 已经默认为 Feign 整合了 Hystrix,所以我们不需要添加依赖。配置文件中需要把 feign.hystrix.enabled 属性设置为 true
1 | feign: |
改写 Feign 客户端接口,在 @FeignClient 注解中通过 fallback 属性指定回调类
1 | (value = "product-service", fallback = ProductFeignClientFallback.class) |
创建回调类,这个类需要实现 @FeignClient 的接口,其中实现的方法就是对应接口的回退方法
1 |
|
1 |
|
验证结果
- 启动项目 eureka-server、product-service、order-service-feign-hystrix
- 访问 http://localhost:8081/product/1 ,得到正常结果
- 关闭 product-service 服务,再访问 http://localhost:8081/product/1 ,得到结果
{"id":-1,"name":"默认商品","description":null,"price":null,"count":null}。说明当调用的服务不可用时,执行了回退方法
通过 fallbackFactory 检查回退原因
如果需要查看回退原因,可以使用注解 @FeignClient 中的 fallbackFactory 属性
1 | (value = "product-service", fallbackFactory = ProductClientFallbackFactoty.class) |
同时创建 ProductClientFallbackFactoty 类,实现 FallbackFactory 接口,create 方法有个 Throwable 参数记录回退原因
1 |
|
测试一下结果,当调用的服务不可用时,会进入回调方法中,并打印如下日志
1 | 2019-05-06 14:21:20.384 INFO 8056 --- [ HystrixTimer-1] c.t.o.c.ProductClientFallbackFactoty : fallback, caused by: |
Hystrix 监控
Hystrix 还提供了一些监控,当 HystrixCommand 和 HystrixObservableCommand 在执行时会产生会产生执行的结果和运行指标。可以配合 spring-boot-starter-actuator 模块同时设置 management.endpoints.web.exposure.include: hystrix.stream,通过 /actuator/hystrix.stream 端点来获取指标信息
1 | <dependency> |
1 | management: |
当有 HystrixCommand 方法被执行,访问 /actuator/hystrix.stream 可以重复看到一些信息
Feign 项目需要添加依赖
spring-cloud-starter-netflix-hystrix,并在主类上加上注解@EnableCircuitBreaker,才能使用/actuator/hystrix.stream端点
Hystrix Dashboard 监控面板
使用 Hystrix Dashboard 可以让上面的监控数据可视化,新建一个 Spring Boot 工程 hystrix-dashboard,添加依赖 spring-cloud-starter-netflix-hystrix-dashboard
1 | <dependency> |
然后在主类上添加注解 @EnableHystrixDashboard
1 |
|
设置服务端口 server.port=8000,启动 hystrix-dashboard,访问 http://localhost:8000/hystrix 可以看到以下界面
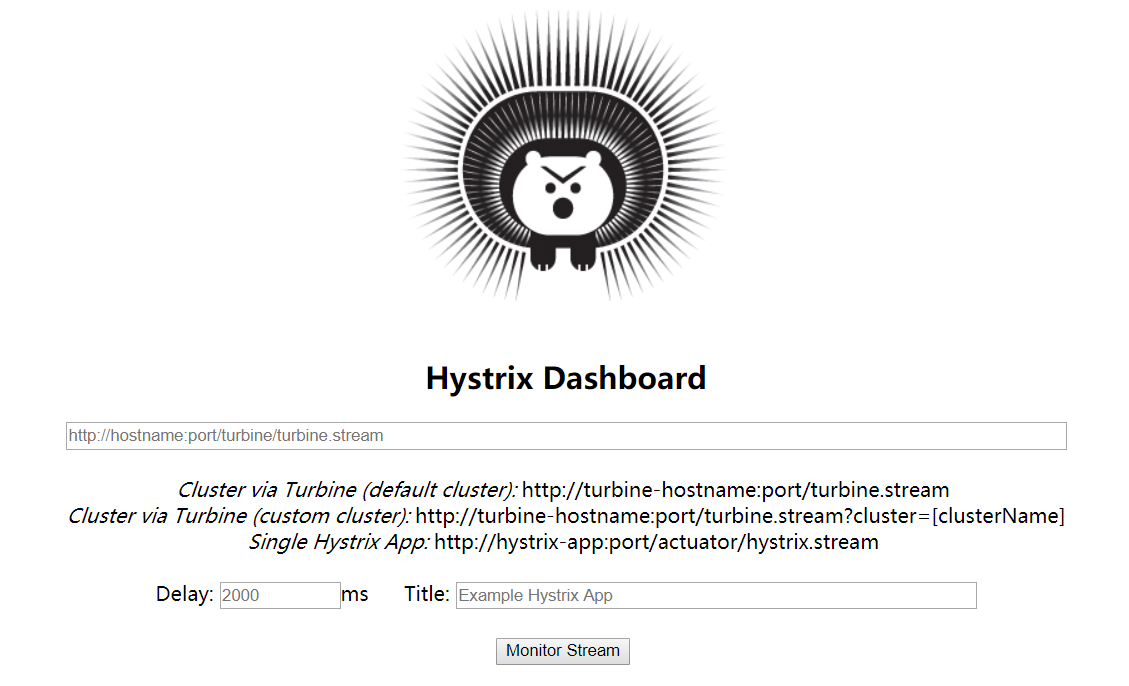
从上面的界面我们可以看到,Hystrix Dashboard 面板监控支持三种方式:默认的集群监控、自定义的集群监控、单个应用的监控。其中前两个集群的方式是需要结合 Turbine 实现,后面去用到。另外 Delay 是轮询监控信息的延迟时间,Title 是监控界面标题,默认是监控实例的 URL
- 默认的集群监控:
http://turbine-hostname:port/turbine.stream - 自定义的集群监控:
http://turbine-hostname:port/turbine.stream?cluster=[clusterName] - 单个应用监控:
http://hystrix-app:port/actuator/hystrix.stream
那我们把上面例子的 order-service-ribbon-hystrix 服务添加 hystrix 监控相关的端点,pom.xml 添加依赖 spring-boot-starter-actuator,设置配置属性 management.endpoints.web.exposure.include=hystrix.stream,同时确保在主类上已经使用注解@EnableCircuitBreaker 或 @EnableHystrix
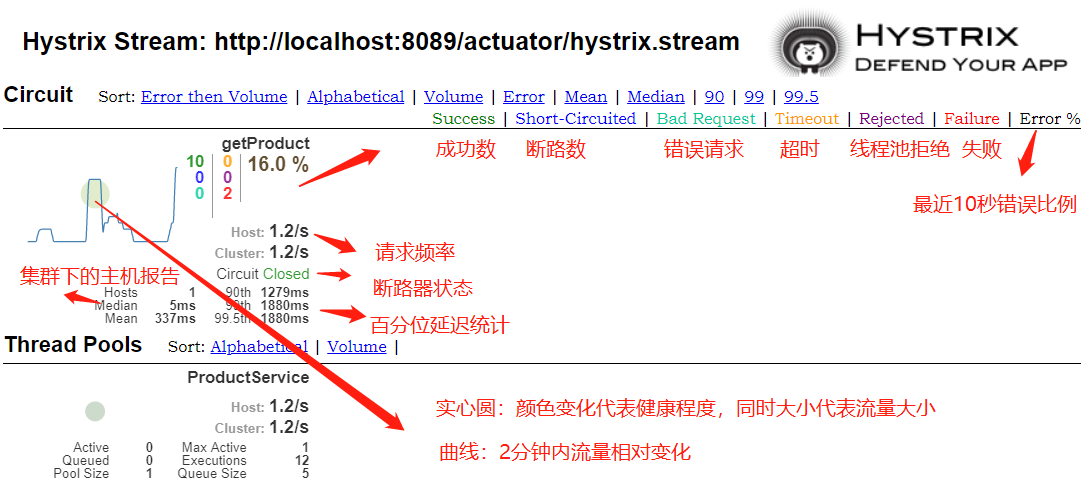
完成配置后,启动项目,把地址 http://localhost:8081/actuator/hystrix.stream 添加到面板页面,可以看到以下界面
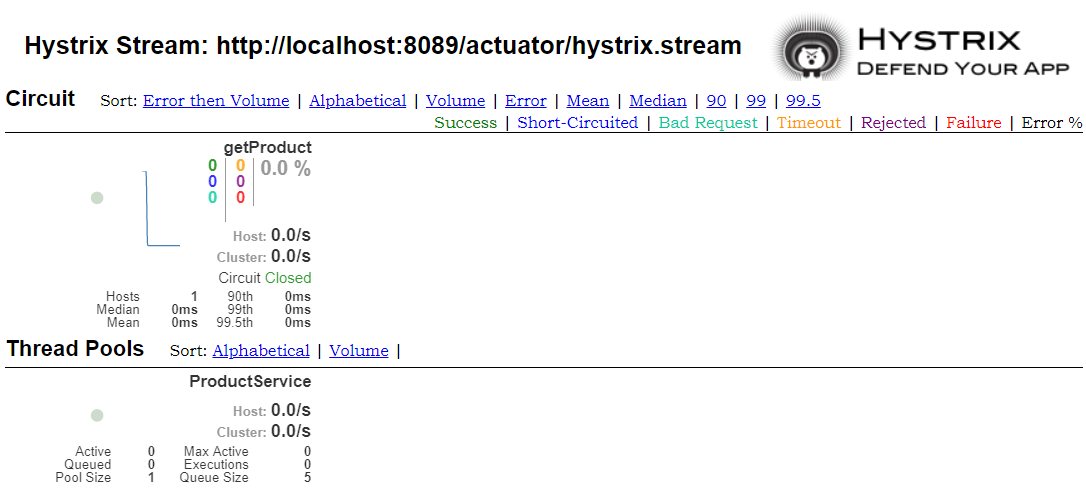
上面展示了 getProduct 这个 HystrixCommand 的各项指标,各指标含义可以看下图
Turbine 聚合监控数据
Turbine 是聚合 Hystrix 监控数据的工具,上面的 Dashboard 面板可以可视化一个 /actuator/hystrix.stream 端点的数据,但是对于多个服务和并且每个服务有多个实例,来回的切换想要监控实例的地址就会很不方便。我们需要一个把所有服务的 /actuator/hystrix.stream 端点数据整合起来的工具,这个工具就是 Turbine
创建一个 Spring Boot 项目命名为 hystrix-turbine,部分的依赖入如下,该依赖默认包含了 Eureka Client
1 | <dependency> |
主类上添加注解 @EnableTurbine,该注解的配置中已经配置了服务注册的功能,即相当于包含了 @EnableDiscoveryClient 的功能
1 |
|
配置信息如下
1 | server: |
turbine.app-config 配置用于查找实例的服务名turbine.cluster-name-expression 指定集群名称,服务数量很的多时候,可以启动多个 Turbine 服务聚合不同的集群数据,而该参数可以用来区分不同的聚合turbine.combine-host-port 通过主机名与端口号的组合来进行区分服务
我们分别启动项目 eureka-server:8761、product-service:8071、order-service-ribbon-hystrix:8089、order-service-feign-hystrix:8081

我们可以先测试下 http://localhost:8081/actuator/hystrix.stream 和 http://localhost:8089/actuator/hystrix.stream 的端口有无问题,没有问题我们启动 hystrix-dashboard,在页面输入 http://localhost:8001/turbine.stream 得到的界面如下
